Introduction
Recently, we are given the opportunity to help build and scale up the data capability of our client. We go over and beyond for our clients to make sure that the infrastructure built are scalable and easy to use. Being tool agnostic, we find best solutions for our clients to ensure that the needs of the company doesn’t just end when a project is shipped.
Hmmm where should we start?
Making data analytics happen is at the heart of the problem where we’re given a list of operational metrics (expected to increase) to
Everything Starts with the ELT
Or better known as Extract-Load-Transform. We ingested our client’s data from Redshift into our BigQuery (data warehouse) through a MySql connector.
The architecture can be found in the image below:
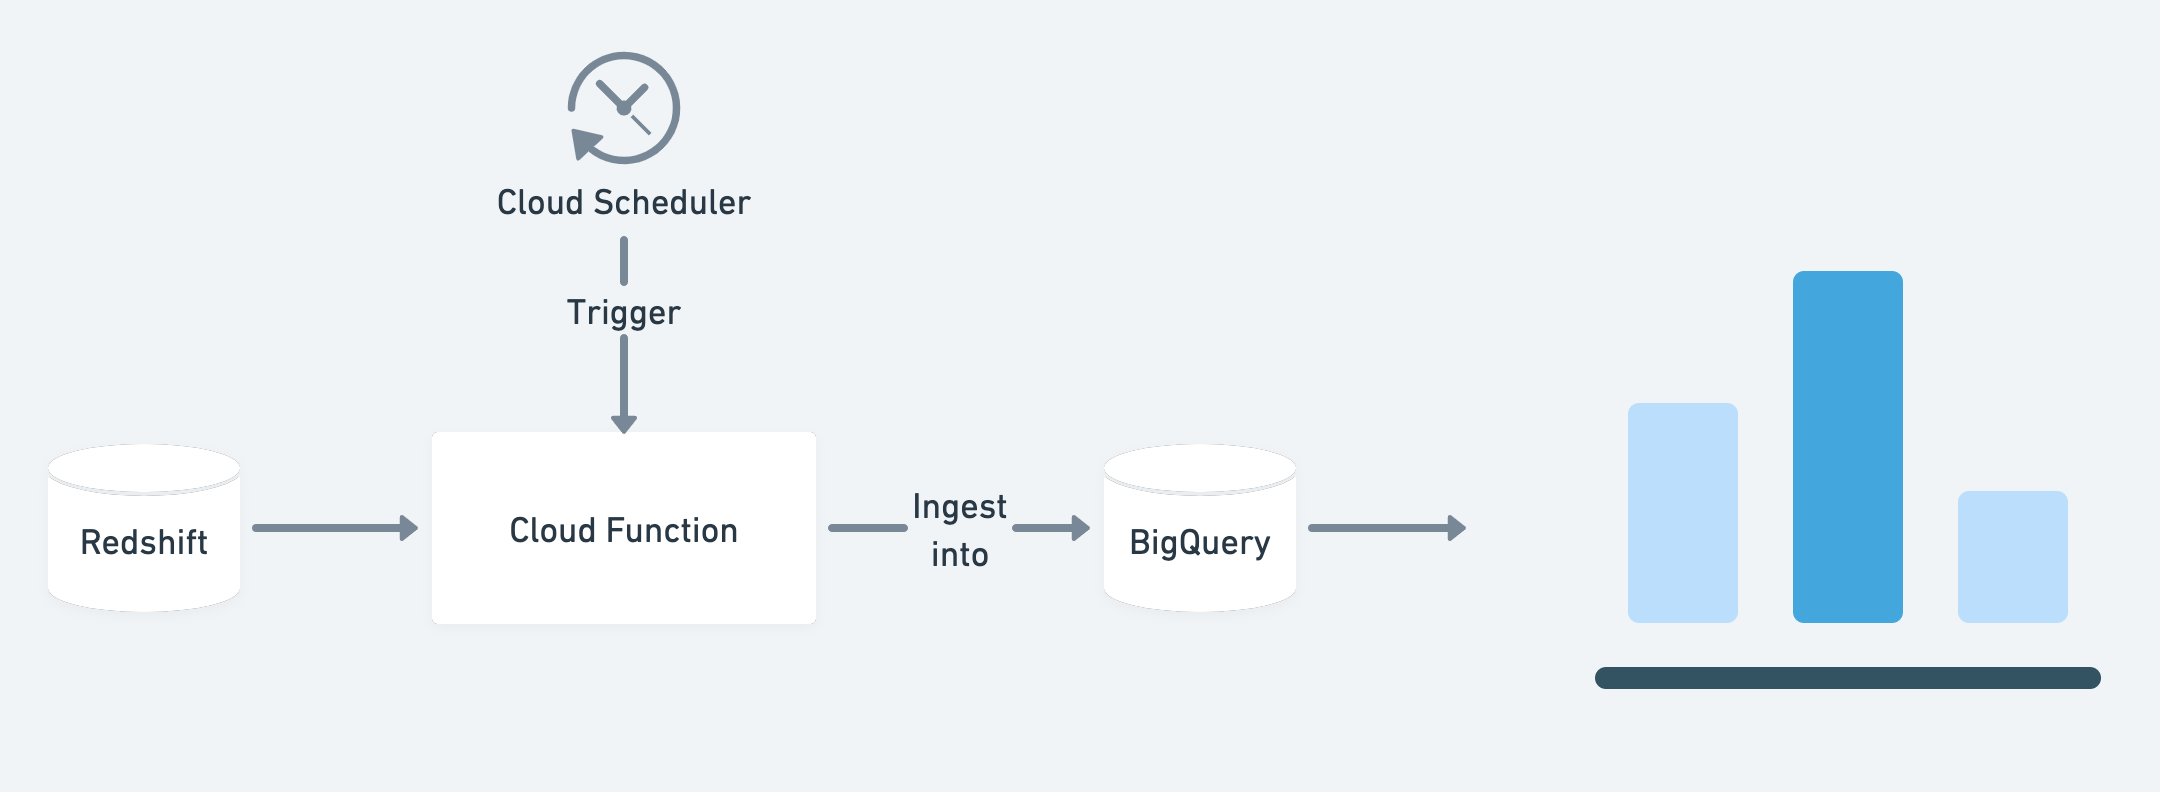
We do our data transformation or wrangling on BigQuery as we would like to utilize its strong data transformation capabilities. Numerous fact tables were created from the raw data and these fact tables are our gold tables. What this would mean is that, they act as the single source of truth where our metrics would be build upon.
Bringing Metrics to Life
The metrics wouldn’t come to life if it wasn’t for the Google’s Looker Studio (Prev. Data Studio). We primarily uses Looker Studio for all of our metrics and using it to visualize charts and graphs. From surveying a bunch of tools such as PowerBI, Tableau, we found that Looker Studio is the perfect solution in terms of cost, performance and ease of use, where it ranks highly in each of the category.
At the time of writing, there are a total of 35 metrics that has been created that covers everything from operations, marketing, finance and business development.
More Technical Implementations
Beyond creating metrics on Looker Studio based on our client’s data, we are also requested to bring in QuickBook’s data. QuickBooks is an accounting software package developed and marketed by Intuit.
It is no easy task as there’s lack in resources online to serve as a guide on ingesting Quickbooks data. We are required to build our own custom Quickbooks data ingestion pipeline using combination of Quickbooks’ API and Python scripts. Do talk to us if you’re also looking for solution such as this!
We are able to bring in many of Quickbooks’ report such as Profit and Loss, Estimation, Invoice and Customer into our BigQuery.
More Analysis
While working on the metrics, the Polar Packet analytics team also come up with multiple cohort analysis that revolves around monitoring and understanding customer retention, customer value and client retention.
Going Beyond into Data Science
Everything shouldn’t stop at data analytics. With the data at hand, we sought out use it for data science purposes. Having run full stack data teams in a few of the largest digital/ tech companies and startups in Asia, we came to realise one crucial fact of companies coming into the 20th century. Small start ups do not have the capital to hire tech and data teams to grow revenue, large corporations do not know how to scale and apply data governance to current practices, that is where we come in.
Several proposal has been presented with projects such as recommendation engines, customer segmentation and demand forecasting at scale. The Polar Packet team has no problem running these projects as we have the experience that our client needs.
Conclusion
We take pride in believing that your journey into data should not be a difficult one thus we ensure that provide meaningful consultation that would lead to long term positive outcome for your business. Our clients love the work we do at Polar Packet, we go over and beyond for our clients to make sure that the infrastructure built are scalable and easy to use. By being tool agnostic, we find best solutions for our clients to ensure that the needs of the company doesn’t just end when a project is shipped. We also partner up with our clients to provide long term resource outsourcing solutions.